Three Financial Compliance Dashboards You Can’t Live Without
Gifts, Entertainment, and Certifications—why they’re Star’s first dashboards and what possibilities they offer for the financial compliance function
Last week in this space, we talked about how embedded analytics were transforming the financial compliance function by allowing compliance officers to push data down to the first line of defense—allowing supervisors to do some of the employee oversight work that could only previously be done by compliance officers proper, relieving the strain on overstretched departments. This week we’re going to talk about the compliance functions Star chose to first apply its dashboard technology to—Gifts, Entertainment, and Certifications—and why.
GIFTS & ENTERTAINMENT DASHBOARDS
“We went on the road to talk to our clients, asking them what types of reports they would be most interested in us building, because that’s what dashboards are in the end: dynamic, interactive, near-real time reports. Gifts, as well as entertainment, came up as the most universally called for.” So says Ryan Sheridan, Star’s Executive Director Of Product, and one of the people behind Star’s push to develop and deploy dashboard analytics.
So why were gifts and entertainment dashboards at the top of clients’ wish lists? One of the reasons is that this kind of spending is nearly universal. A large percentage of an employee population does it, or can do it. It can thus touch every part of a firm and every manager. It’s also generally understood that gifts and entertainment spending goes underreported, versus, say, personal trading. Sheridan: “On the whole, I think, people do report their trades, but I think reporting of gifts and entertainment spending in most organizations is patchy, at best.”

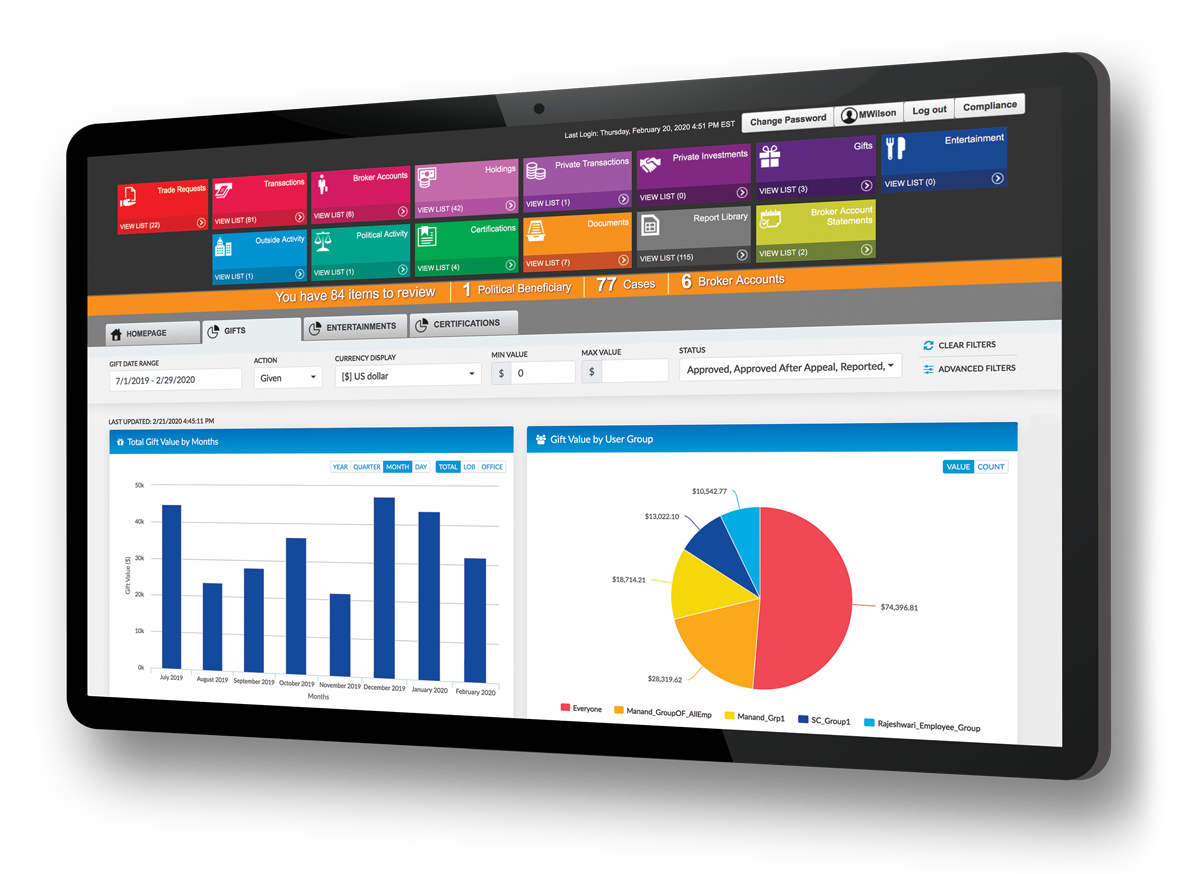
Star Gifts and Entertainment dashboards allow you to slice and dice the data being presented to you, so you get a complete picture of what’s coming into and leaving the firm. Filter and flip between “given” and “received” data. Pick your currency. Include or exclude particular offices. Aggregate results by line of business or top employees, in terms of who’s giving or receiving the most gifts by value. View by organization or by type of gift. Filter and drill down by time period. “The key thing here,” says Sheridan, “is that while some of this info has been available in the app, it’s been a bit difficult to get at. So we’re making it a lot easier. We’re making it a lot more prominent. Previously, we’ve given clients the tools to build reports, but the final result wasn’t always easy to glean insights from. With dashboards, the data is not just unerringly complete but much more immediate: no more spending hours or days to get to a clear, meaningful visual.”
CERTIFICATIONS DASHBOARD
Like Gifts and Entertainment, the decision to develop and deploy a Certifications dashboard was client driven. Sheridan: “Our clients told us they wanted an easier way to track certs completion. There are a lot of people chasing down certs out there. Like gifts and entertainment, certs have the capacity to affect the entire organization. We hear from most of our clients that pre-STAR Platform adoption, certs completion success rates were less than impressive, and the time to capture all completed certs could extend well past the deadline. Post-STAR implementation, we have clients achieving 100% completion, but for some it still took a couple of years to get there. Dashboards will get them there much more quickly.”

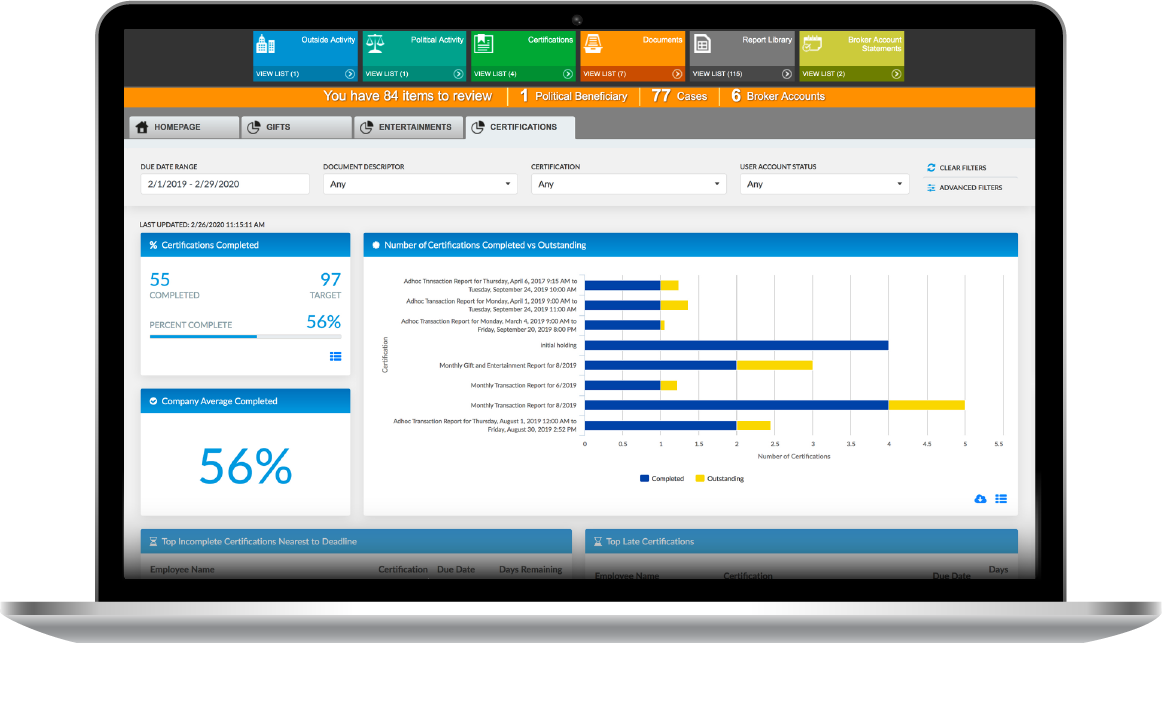
With this dashboard, someone running a certs program can see right away what the completion rate is, the percentage completion for each individual cert, who’s coming up to the deadline, and who’s outright late. Master controls at the top of the dashboard interface let you easily narrow or expand your data views. There’s an animation aspect, which give the dashboards an interactive feel, especially since they’ll have such a high refresh rate. And since data visibility is dictated by job roles, groups, and relationships you’ve previously defined in the STAR Platform, dashboard users only see the data they’re supposed to. Finally, across all three dashboards, individual charts such as PDFs, PNGs, or Excel documents are fully downloadable for use in presentations. “If you’re preparing a PowerPoint,” says Ward, “You can lift high-quality graphics straight from the dashboards.”
DASHBOARDS OF THE NOT-SO-DISTANT FUTURE
Sheridan: “One idea in the hopper is an analytical certs dashboard. If the current one is for supervisors, what’s going on actively, the next would be for certifications trend analysis. What did I do differently that impacted the results? How did we get from a 50% to 80% completion rate? The focus for our dashboards is always actionable intel, whether the use is tactical or more strategic. It’s about putting the right information in front of the right people, wherever in the organization they are and whatever their official role might be. In some sense, our dashboards allow managers at every level to be compliance officers: to have an important hand in monitoring, mitigating, and reducing firm and employee risk. Our dashboards empower.”
90 Days Compliance Leader’s Worksheet


